If you run paid media for a DTC brand, you already know the feeling. You launch a new batch of creatives on Monday, and by Wednesday you are buried in platform dashboards trying to figure out which hook, which format, and which angle is actually driving results.
The problem is not a lack of data. It is that the data lives in six different tabs, two different ad platforms, and a spreadsheet your media buyer forgot to update.
That is exactly why creative analytics tools have exploded over the past two years. The best ones do not just show you metrics. They help you understand why certain creatives win, spot fatigue before your ROAS craters, and give your creative team a feedback loop that actually works.
This guide breaks down the landscape so you can pick the right tool for your team, your budget, and your growth stage.
Why Creative Analytics Matters More Than Ever for DTC
Performance marketing used to be a targeting game. Find the right audience, serve a decent ad, and scale. That playbook is dead.
Privacy changes, algorithm shifts, and broad targeting have moved the competitive battleground squarely onto creative. Meta's own guidance now tells advertisers to focus on creative volume and iteration rather than audience micro-segmentation. Google's Performance Max campaigns treat creative assets as the primary optimization lever.
For DTC brands specifically, the stakes are even higher:
- Average creative lifespan has dropped. Audiences burn through ads faster than they did two years ago, and fatigue sets in within days on high-spend accounts.
- Cross-channel consistency matters. Your Meta ads, Google display assets, and YouTube spots all need to tell a coherent story, but each platform reports differently.
- Creative is the new moat. When everyone has access to the same audiences and bidding algorithms, the brand that iterates faster on creative wins.
Without a dedicated analytics layer for creative performance, you are flying blind. You might know what is working, but you will struggle to understand why it is working and how to replicate it.
What to Look For in a Creative Analytics Tool
Before diving into specific categories, it helps to have a framework. Not every tool does everything, and that is fine. The key is knowing which capabilities matter most for your team.
Cross-Channel Coverage
If you run ads on both Meta and Google (and most DTC brands do), you need a tool that pulls data from both platforms into a single view. Switching between Meta Ads Manager and Google Ads to compare creative performance is a productivity killer.
Creative-Level Granularity
Campaign-level and ad set-level reporting is table stakes. What you actually need is the ability to drill down to individual creatives, isolate specific visual or copy elements, and compare performance across variations.
Automated Reporting and Alerts
The best insights are useless if they arrive too late. Look for tools that can push performance updates to where your team already works, whether that is Slack, email, or a shared dashboard. Fatigue alerts and anomaly detection save money.
Competitive Intelligence
Understanding your own performance is only half the picture. The ability to see what competitors are running, which of their creatives have been active longest (a proxy for performance), and where the market is heading gives you a strategic advantage.
AI-Powered Analysis
In 2026, basic charting is not enough. The tools pulling ahead use AI to surface patterns humans would miss: which color palettes correlate with higher engagement, which hook structures drive the best thumb-stop rates, and which creative formats are trending in your category.
Ease of Use and Team Collaboration
A tool is only as good as its adoption rate. If your media buyer loves it but your creative director never logs in, you have lost half the value. Look for platforms designed for cross-functional teams, not just data analysts.
The Tool Landscape: Categories Worth Knowing
The creative analytics space is not monolithic. Tools tend to fall into a few distinct categories, and understanding the tradeoffs helps you make a smarter choice.
All-in-One Creative Intelligence Platforms
These are the platforms that aim to be your single source of truth for creative performance. They typically combine cross-channel ad analytics, creative-level reporting, competitive intelligence, and some form of AI analysis.
Best for: Teams that want a unified workflow and are tired of stitching together point solutions.
What to watch for: Some all-in-one platforms sacrifice depth for breadth. Make sure the creative analytics layer is genuinely strong and not just a dashboard bolted onto a media buying tool.
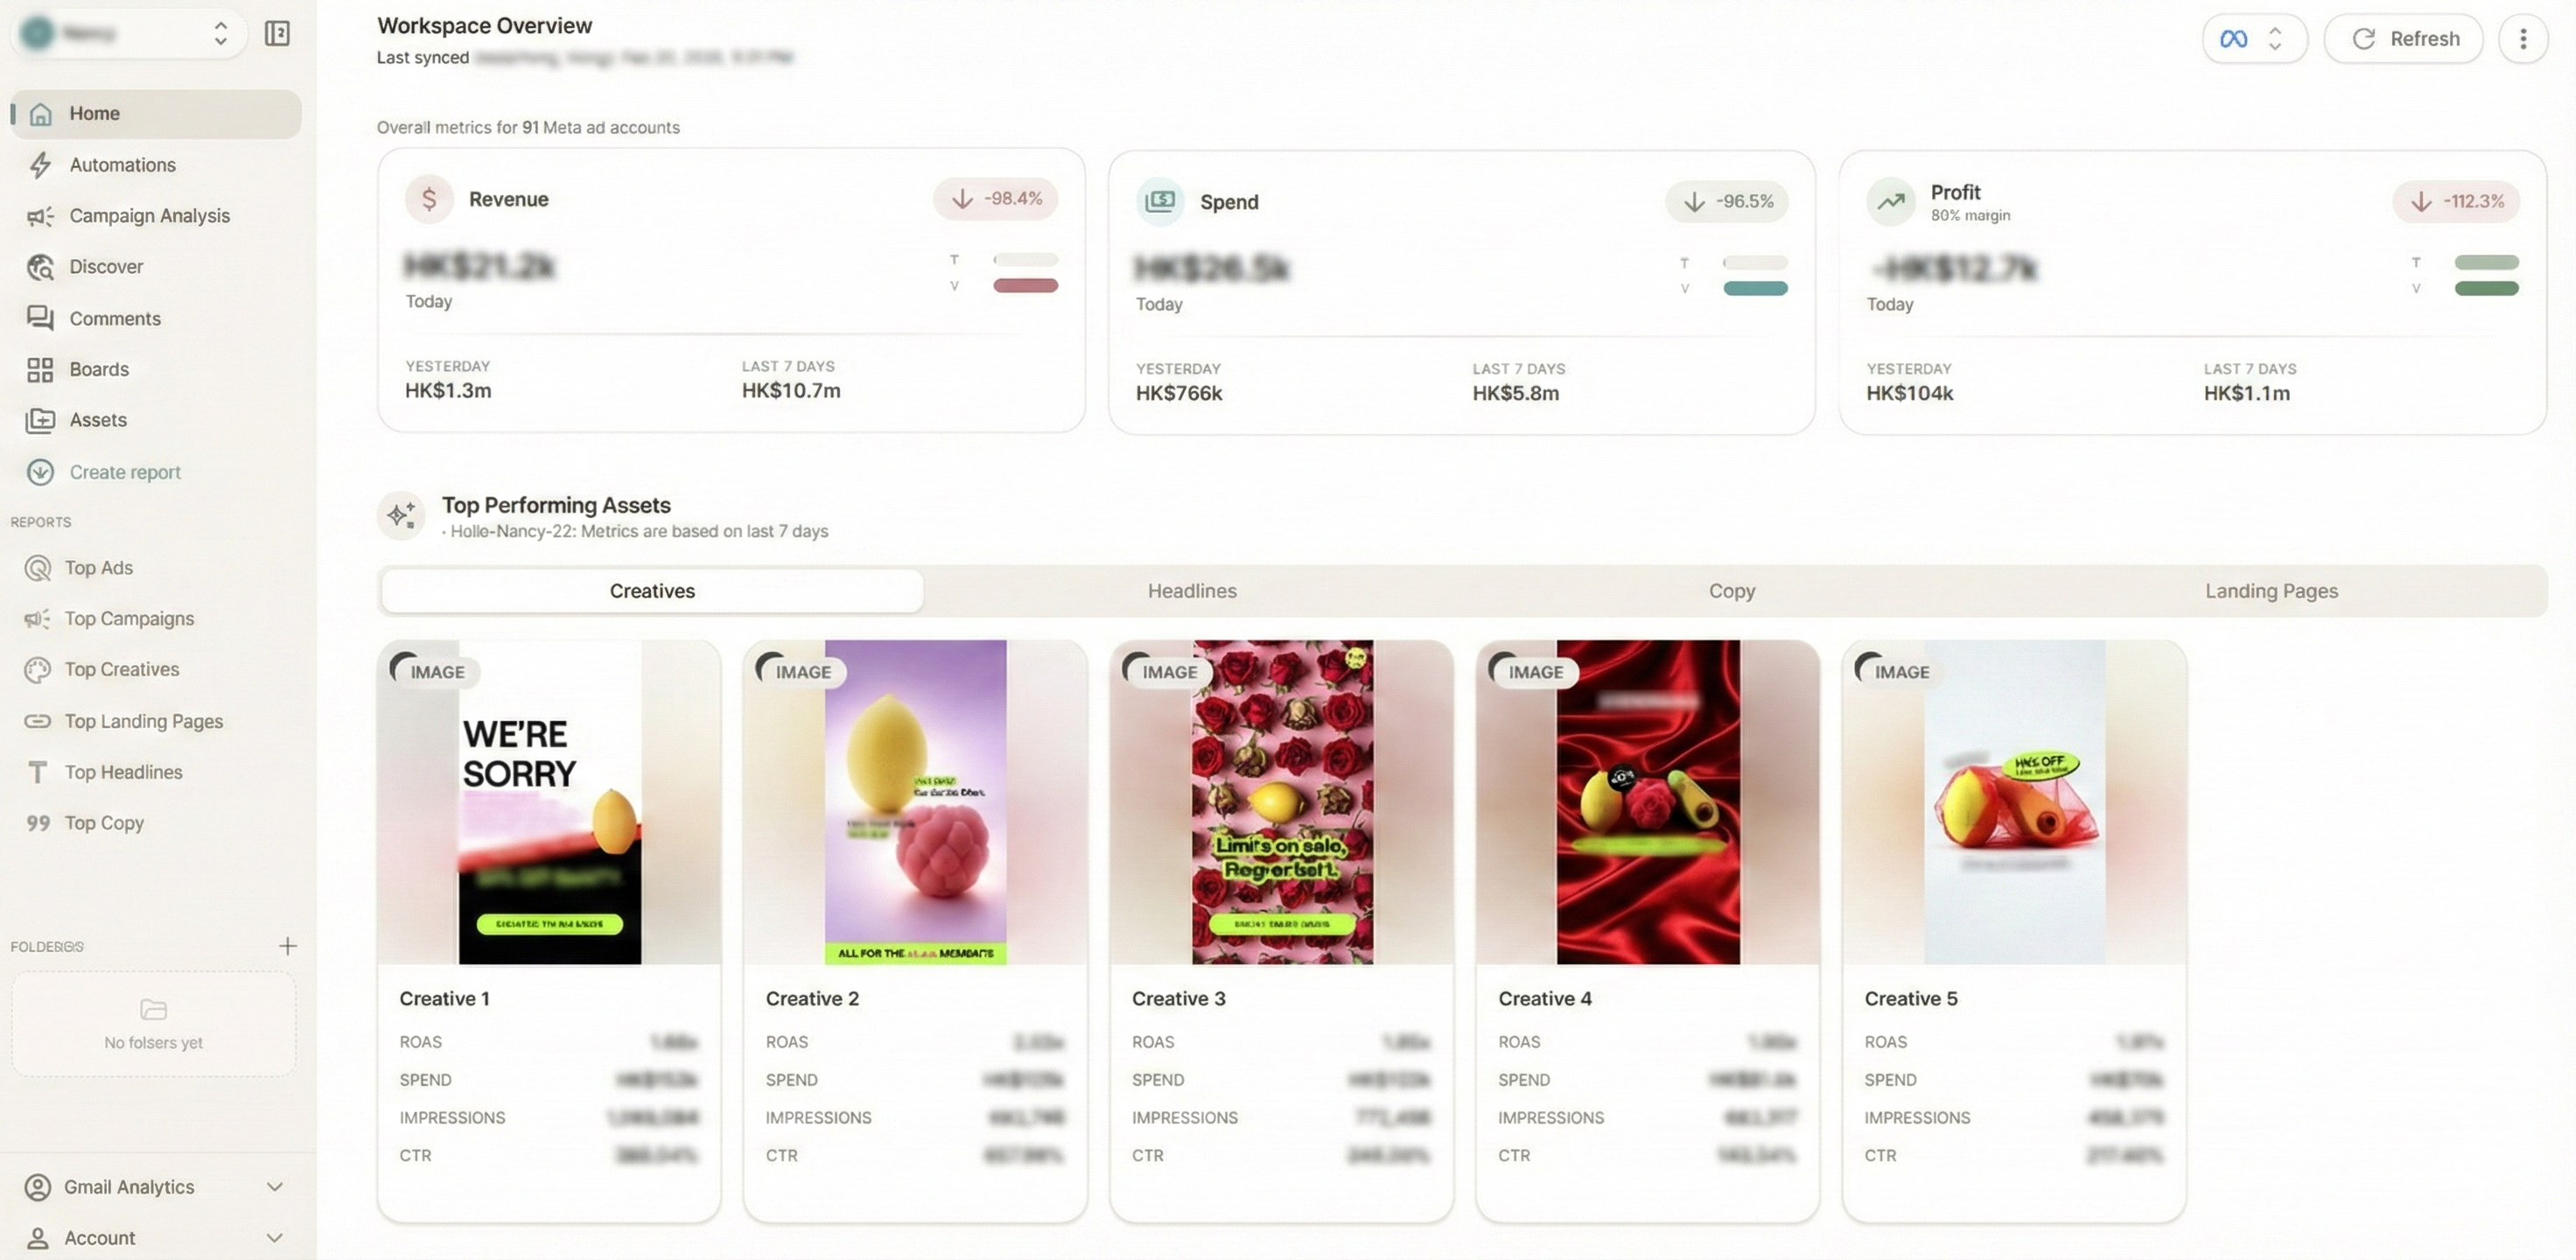
This is the category where Glued sits. Glued was built specifically for performance marketing teams at DTC brands who need cross-channel creative analytics (Meta and Google Ads), competitor ad discovery, AI-powered creative analysis, and automated Slack reporting in a single platform. Rather than forcing you to jump between five tabs, Glued pulls everything into one workspace that both media buyers and creative strategists can use together.
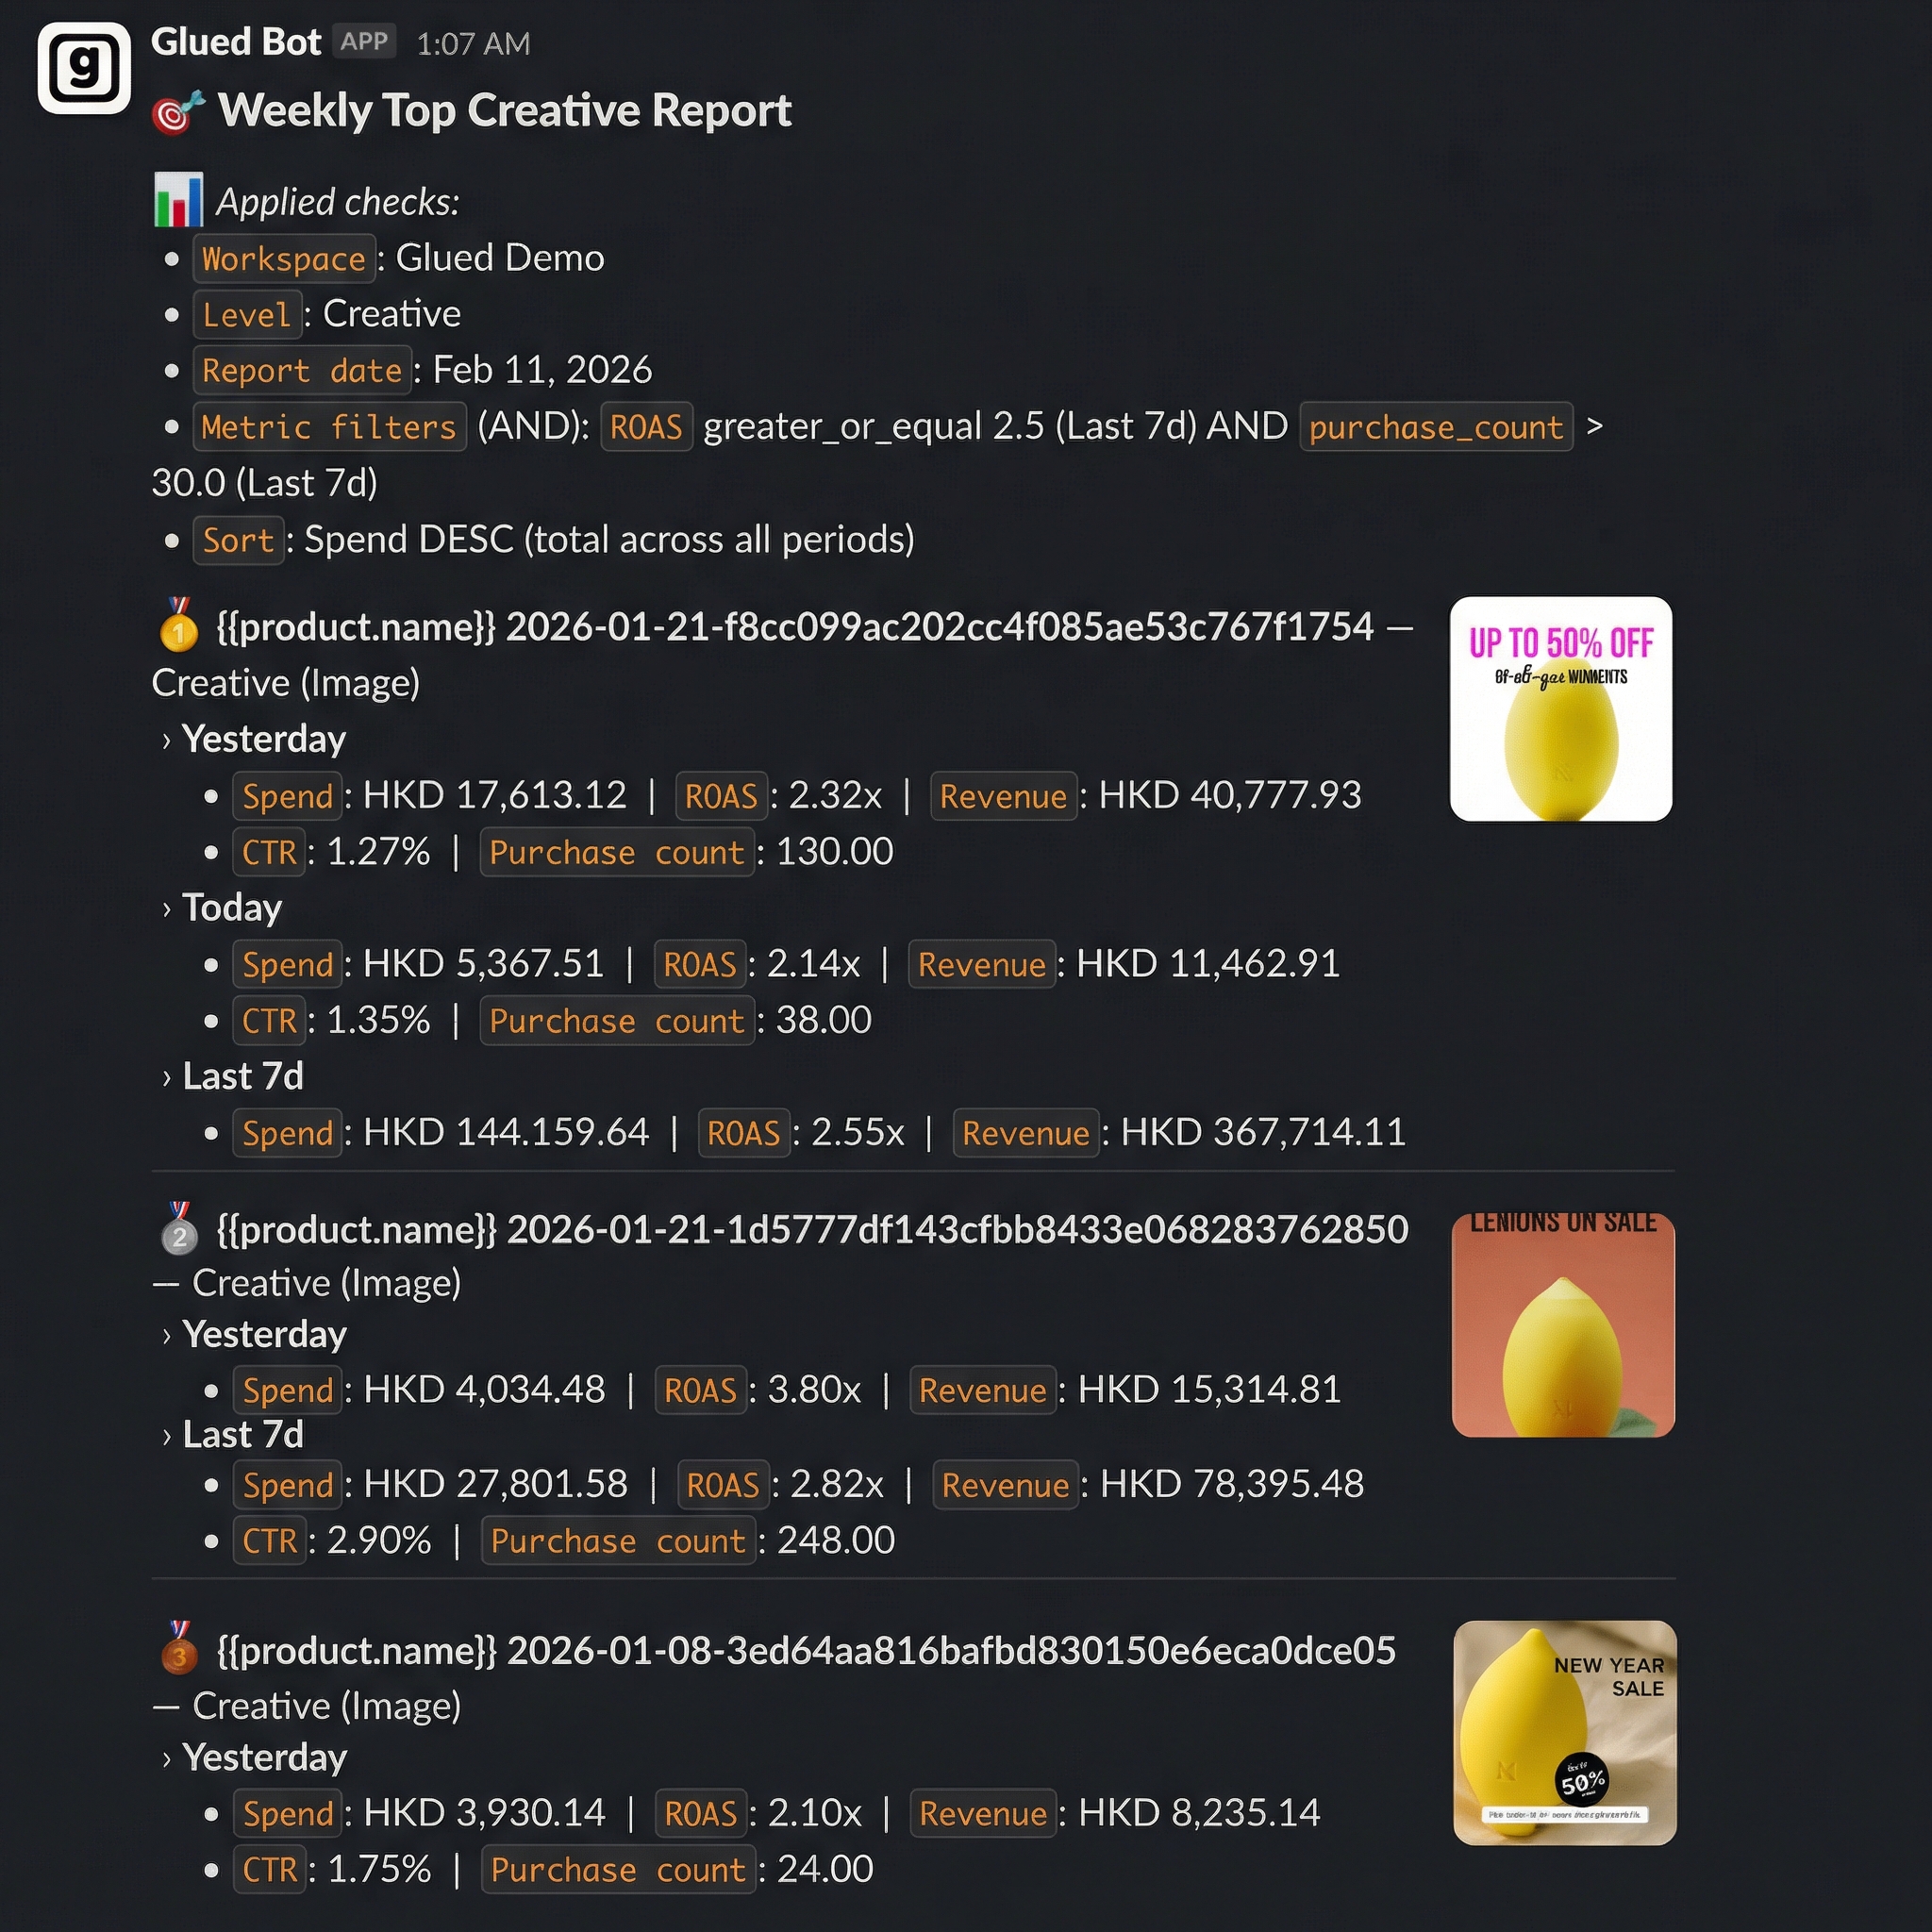
What makes Glued particularly compelling is its focus on actionable insight delivery. Instead of waiting for your weekly reporting meeting, Glued pushes automated digests and alerts directly to Slack, so your team spots creative fatigue, winning patterns, and competitor moves in real time.
Standalone Creative Analytics Tools
These tools focus narrowly on analyzing ad creative performance. They typically connect to your ad accounts and provide detailed breakdowns of creative elements, A/B test results, and performance trends.
Best for: Teams that already have a BI tool or data warehouse handling their broader analytics and just need a creative-specific layer.
Tradeoffs: You will usually still need separate tools for competitive intelligence, reporting automation, and cross-channel aggregation. The integration overhead can add up.
Ad Library and Competitive Spy Tools
These tools let you browse and search competitor ads across platforms. Some scrape the Meta Ad Library and Google Ads Transparency Center, while others maintain proprietary databases of ads and landing pages.
Best for: Creative strategists who need inspiration and competitive context before building new concepts.
Tradeoffs: Most spy tools are purely observational. They show you what competitors are running but cannot connect that data back to your own performance metrics. The gap between "what they are doing" and "what you should do" still requires human judgment or a separate analytics platform.
AI Creative Generation and Optimization Tools
A newer category that uses generative AI to produce ad creative variations, suggest copy improvements, or predict performance before you spend a dollar on media.
Best for: Teams with limited creative production capacity who need to increase output volume.
Tradeoffs: Generation without analytics is risky. Producing more creative does not help if you cannot measure what works. The smartest approach is to pair a generation tool with strong analytics, or choose a platform that does both.
How to Evaluate Tools: A Practical Checklist
When you are comparing options, run each tool through these questions:
- Does it connect to all the ad platforms I use? At minimum, Meta and Google Ads. Bonus points for TikTok, Pinterest, or programmatic.
- Can I see creative-level performance, not just campaign-level? This is non-negotiable for any serious creative analytics workflow.
- Does it support my team's workflow? If your team lives in Slack, a tool with strong Slack integration is worth more than one with a prettier dashboard.
- How fast is the data? Some tools sync daily, others near real-time. For high-spend accounts, freshness matters.
- Is there a competitive intelligence layer? Even a basic one adds significant strategic value.
- What does the AI actually do? "AI-powered" is meaningless without specifics. Does it tag creative attributes automatically? Surface performance patterns? Predict fatigue?
- What is the pricing model? Per-seat, per-ad-account, or flat-rate? Make sure you model the cost at your expected scale.
- Can I try it before committing? A free trial or interactive demo is a strong signal that the company trusts its product.
Common Mistakes When Choosing a Creative Analytics Tool
Even smart teams get this wrong. Here are the pitfalls to avoid.
Optimizing for Features You Will Never Use
A tool with 50 features sounds impressive until you realize your team uses three of them. Start with your actual workflow pain points and work backward to the tool, not the other way around.
Ignoring the Reporting and Distribution Layer
Dashboards are great, but dashboards that nobody checks are expensive decoration. The tools that drive real behavioral change are the ones that push insights to your team proactively. Automated Slack digests, email summaries, and anomaly alerts are worth more than a beautiful chart library.
Treating Creative Analytics as a Media Buyer Problem
Creative performance data is most valuable when it flows to the people making the creative. If your analytics tool is designed exclusively for media buyers, your designers and copywriters will never engage with it. Look for platforms that bridge the gap between performance data and creative decisions.
Buying Separate Tools for Everything
Point solutions can work, but the integration tax is real. Every additional tool means another login, another data sync to manage, and another vendor relationship. Before assembling a five-tool stack, consider whether an all-in-one platform covers enough of your needs to simplify the workflow.
What the Best DTC Teams Are Doing Differently in 2026
The brands winning the creative game right now share a few common traits:
- They treat creative as a data discipline. Every new concept is tagged, tracked, and analyzed. Nothing ships without a hypothesis.
- They shorten the feedback loop. Instead of monthly creative reviews, they run weekly or even daily cycles informed by real-time analytics.
- They watch competitors strategically. Not to copy, but to understand market positioning and identify whitespace.
- They centralize their tools. The most efficient teams have reduced their creative analytics stack to one or two core platforms rather than juggling five.
- They automate the boring stuff. Reporting, tagging, and anomaly detection happen automatically so humans can focus on strategy and craft.
Getting Started: Picking the Right Tool for Your Stage
Your ideal tool depends on where you are as a business.
Early stage (under $50K/month in ad spend): You probably do not need a full creative intelligence platform yet. Start with native platform reporting and a simple competitive spy tool. Build the habit of reviewing creative performance weekly.
Growth stage ($50K-$500K/month): This is where dedicated creative analytics pays for itself. A platform like Glued that combines cross-channel reporting, competitive intelligence, and automated Slack updates can save your team hours every week while surfacing insights that directly improve ROAS.
Scale stage ($500K+/month): At this level, you need depth and breadth. Look for platforms with robust API access, custom reporting, and the ability to handle large volumes of creative variations across multiple brands or product lines.
Final Thoughts
The DTC brands that will win in 2026 are the ones that treat creative as a measurable, improvable system rather than a guessing game. The right analytics tool is the foundation of that system.
If you are evaluating options, we would obviously love for you to try Glued. It was built specifically for the workflow described in this article: cross-channel creative analytics, competitor discovery, AI-powered insights, and automated team reporting, all in one workspace.
But regardless of which tool you choose, the most important step is choosing one at all. Running paid media without creative analytics in 2026 is like driving with your dashboard lights off. You might get where you are going, but you will waste a lot of fuel along the way.