Every media buyer says they test. Launch two ad sets with different headlines. Try a new audience. Swap an image. Call it an A/B test. Move on.
But here is the question nobody asks: what did you learn?
Not "which ad won." That is a result, not a learning. What did you learn about your audience's preferences, your creative strategy, your funnel mechanics? What hypothesis were you testing? What evidence did the test produce?
If you cannot answer those questions, you are not testing. You are gambling with a spreadsheet. And the difference between random testing and a testing framework is the difference between guessing and compounding knowledge.
The Testing Problem in Performance Marketing
Most ad teams run plenty of tests. They just run them badly:
No hypothesis. The test has no stated expectation. Someone says "let us try video instead of image" but nobody articulates why video should perform differently or what metric would prove the hypothesis.
No isolation. The "test" changes three variables at once. If it performs better, you have no idea which change caused the improvement. You changed everything and learned nothing.
No sample size consideration. A test runs for two days, gets 47 clicks, and someone declares a winner. With that sample size, the "winner" had a 60 percent chance of being a statistical accident.
No documentation. The test ends. A month later, nobody remembers what was tested. The same test gets re-run three months later because nobody recorded the outcome.
The result is a team that tests constantly and learns almost nothing.
The Five Components of a Testing Framework
1. Signal Detection: Let the Data Tell You What to Test
Do not brainstorm test ideas from scratch. Systematically scan your account data for signals that suggest testing opportunities.
Signals come in four categories: structural (campaign architecture issues), creative (performance patterns suggesting creative opportunities), audience (targeting patterns suggesting expansion), and operational (efficiency patterns suggesting process improvements).
These signals are already in your data. You do not need to brainstorm --- you need to read the signals your campaigns are already sending.
2. Hypothesis Generation: From Signal to Experiment
Every signal should produce a structured hypothesis:
- Observation: What the data shows
- Hypothesis: What you believe will happen with a specific change
- Change: The single variable you will modify
- Success metric: The KPI that determines whether the hypothesis is supported
- Minimum sample size: Conversions or spend threshold needed for confidence
This specificity prevents the two most common failures: changing multiple variables and declaring winners with insufficient data.
3. ICE Scoring: Prioritize by Impact, Confidence, and Ease
You will always have more test ideas than capacity. ICE scoring rates each experiment 1 to 10 on Impact (how much will this move the needle?), Confidence (how likely is the hypothesis correct?), and Ease (how easy to execute and measure?).
| Experiment | Impact | Confidence | Ease | ICE Score | Priority | |---|---|---|---|---|---| | Cost-cap bid strategy test | 9 | 8 | 8 | 8.3 | P1 | | Dynamic creative consolidation | 8 | 8 | 8 | 8.0 | P1 | | Seasonal creative replacement | 8 | 7 | 8 | 7.7 | P1 | | UK market localization | 8 | 7 | 6 | 7.0 | P2 | | Spend diversification | 6 | 6 | 5 | 5.7 | P3 |
Experiments scoring 7+ are P1 (run now). Scores of 5 to 7 are P2 (run next). Below 5 are P3 (backlog).
4. Concurrency Limits: Do Not Run Too Many Tests
Every test you run simultaneously reduces the statistical power of every other test. A good rule: never run more than four concurrent tests. For accounts under $10,000 per month, two or three is more realistic.
This forces prioritization and prevents interaction effects --- the statistical problem where multiple simultaneous changes make it impossible to isolate which change caused which result.
5. Standardized Postmortems: Close the Learning Loop
Every completed test produces a standardized postmortem: summary, setup, results, validity check, decision, and --- most importantly --- learnings.
A test that fails still produces a learning: "Our audience does not respond better to cost-cap bidding. This invalidates our assumption that bid strategy is an efficiency lever. Next: test creative iteration instead."
Over time, these postmortems build into a knowledge base. That knowledge base is the real output of a testing framework.
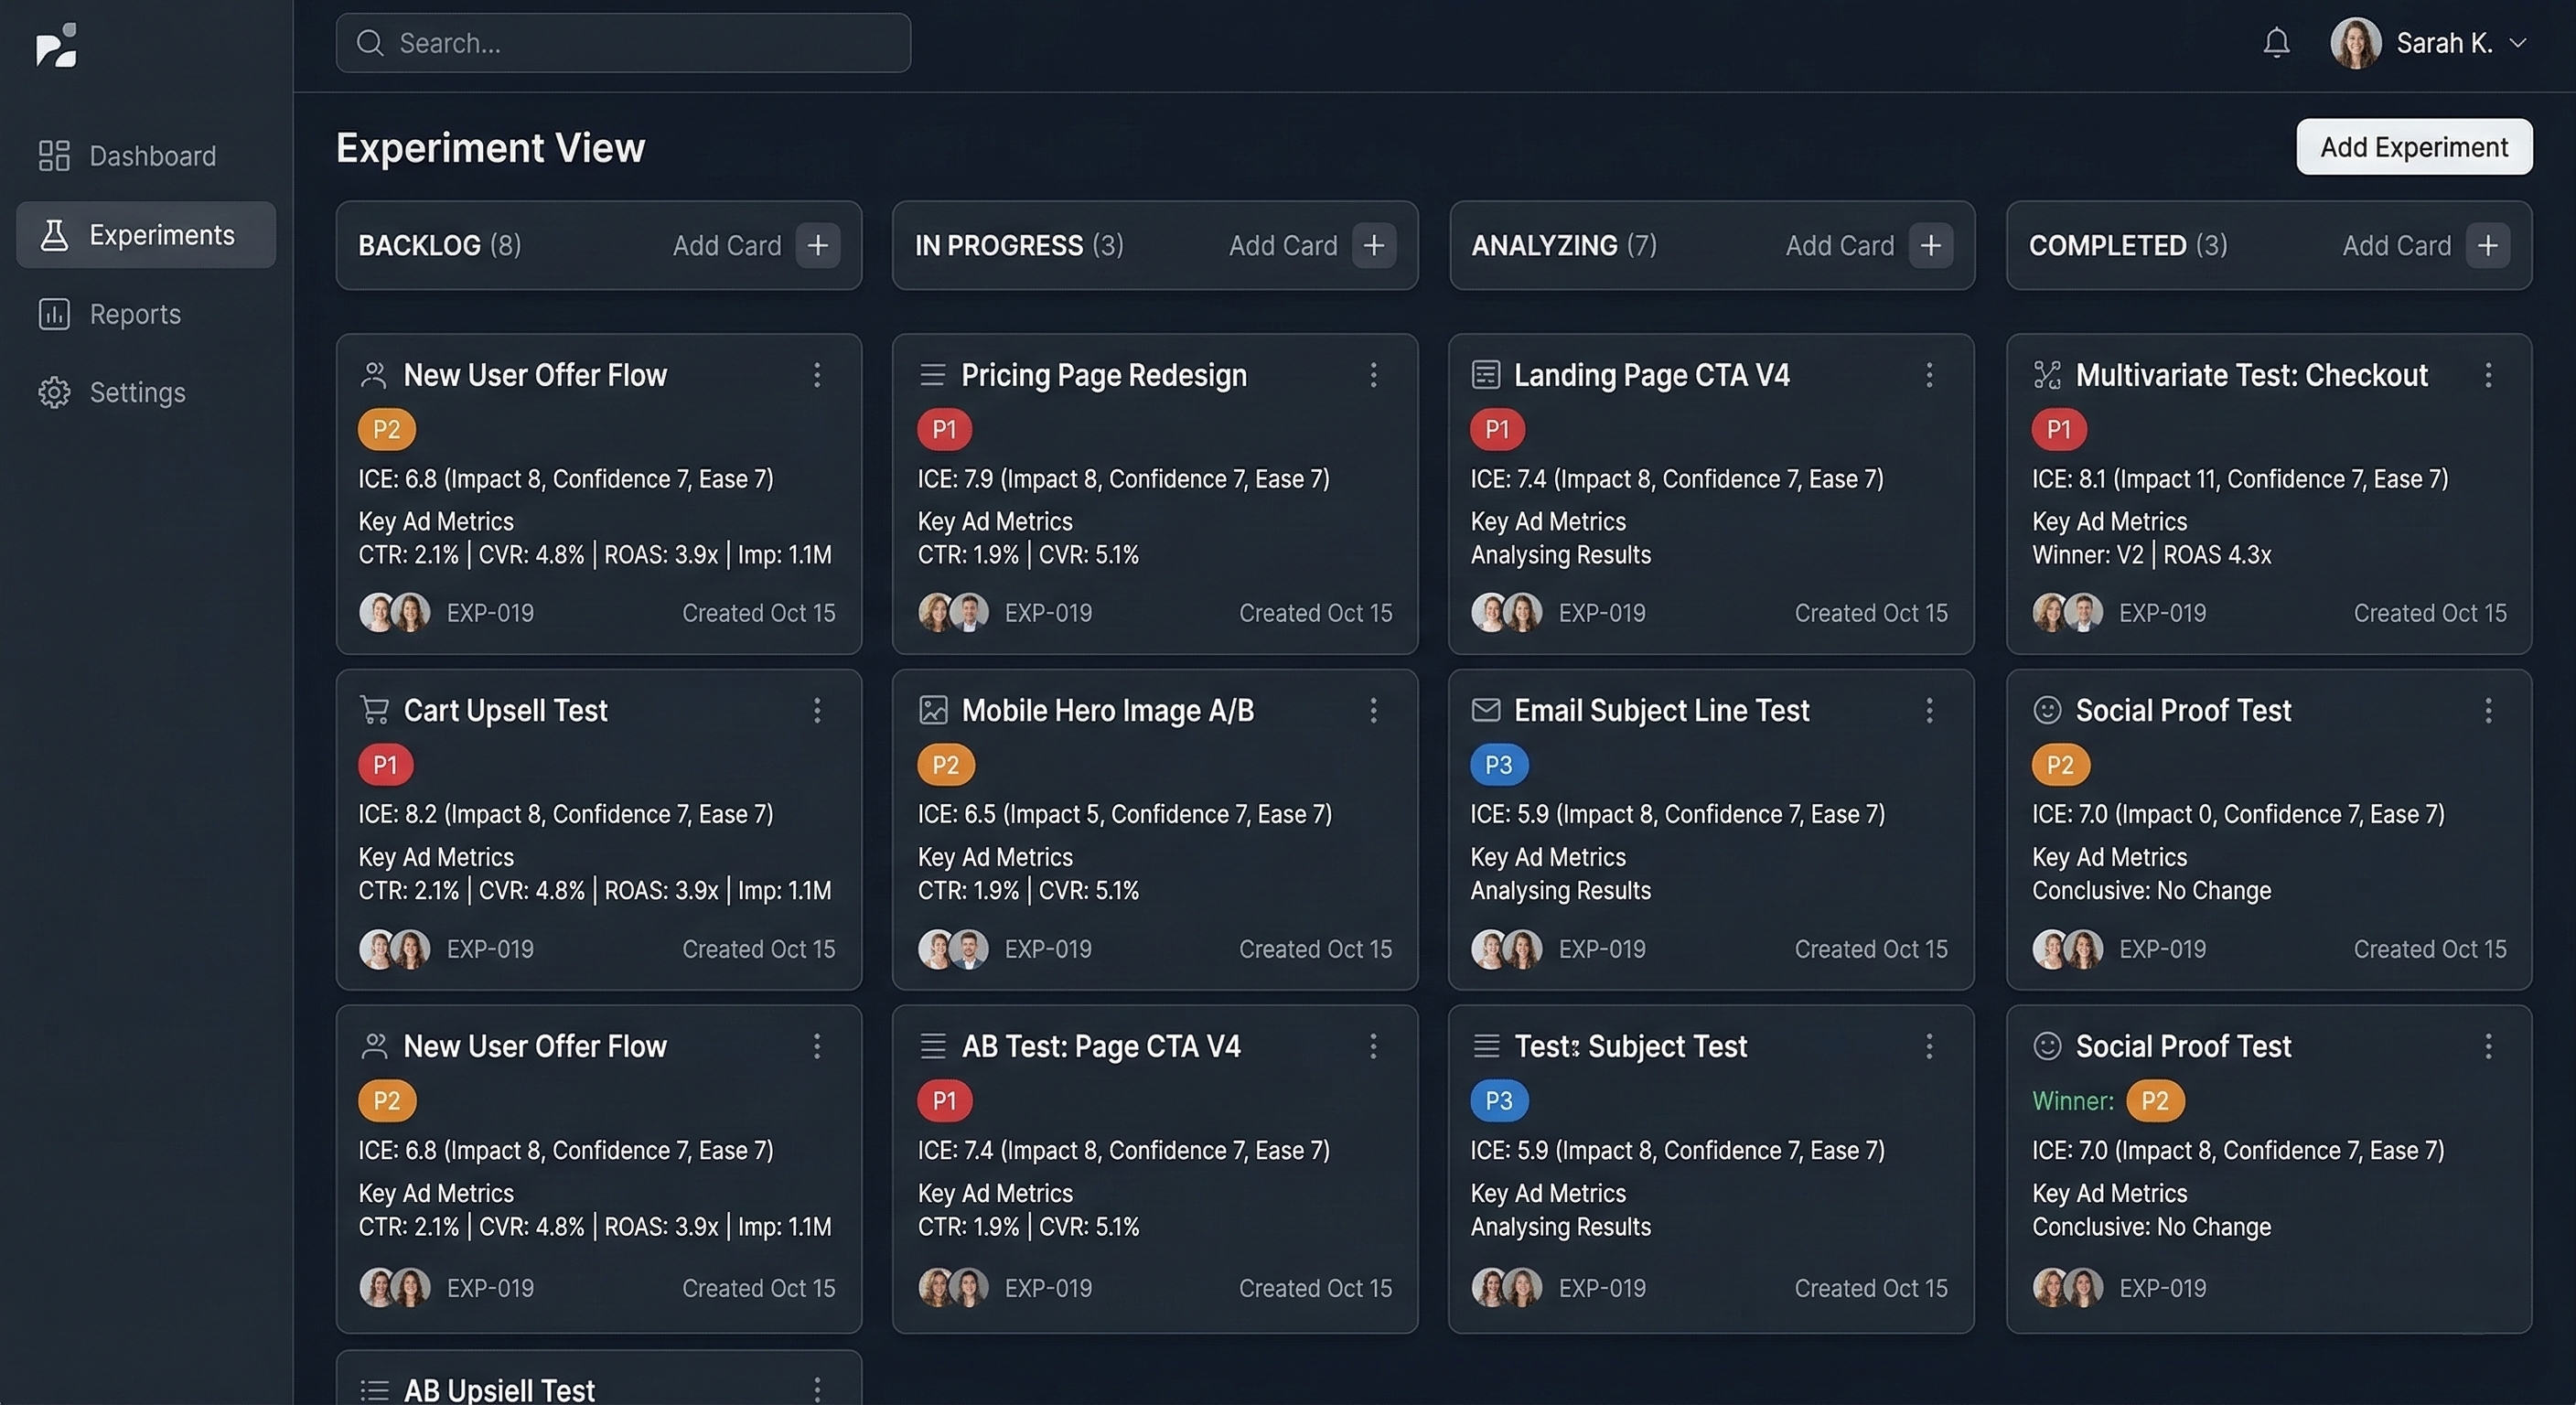
What This Looks Like With Glued MCP
Using Glued's MCP API and the Experiment Designer skill, the entire framework --- from signal scanning to backlog generation --- runs automatically against your live ad data. In a recent run, the system scanned a full ad account, detected 7 distinct signals across structural, creative, audience, and operational categories, generated ICE-scored hypotheses for each, and produced a prioritized experiment backlog with P1/P2/P3 classification.
The system also generated postmortem templates for each experiment, pre-filled with the hypothesis, success metrics, and minimum sample sizes --- so the learning loop is built into the process from day one.
The Compounding Effect
Random testing produces linear results at best. Framework-based testing compounds. Each test builds on the last. After six months, you are not just "testing things" --- you are operating on a deep understanding of your account dynamics that competitors who test randomly will never develop.
Two teams with the same budget, product, and creative talent will produce dramatically different results if one tests systematically and the other tests randomly. The systematic team gets smarter every week.
Getting Started
You do not need a complex tool to start:
- A signal scan. Pull 30 days of campaign data. Look for structural, creative, audience, and operational signals.
- A backlog. Turn each signal into a hypothesis. ICE-score it. Pick the top four.
- A test tracker. Columns: experiment name, hypothesis, variable changed, success metric, start date, end date, result, decision, key learning.
- A cadence. Weekly: check active tests. Biweekly: close completed tests, write postmortems, launch next. Monthly: rescan signals and refresh the backlog.
Build the system once. Run it every week. And watch the compounding effect turn your ad account into an intelligence machine.
Ready to build a testing framework powered by real data? Glued's ad performance reports and MCP API give you the data infrastructure to scan signals, track experiments, and measure outcomes across all your Meta and Google Ads campaigns. Start your free trial at glued.me and start testing like you mean it.